BENCHMARKING
How to compare content performance and set up scorecards to establish best practices
Why is it important?
Identify what's working well
Identify areas for improvement
Define best practice
Guide future content strategy
Efficient content operations
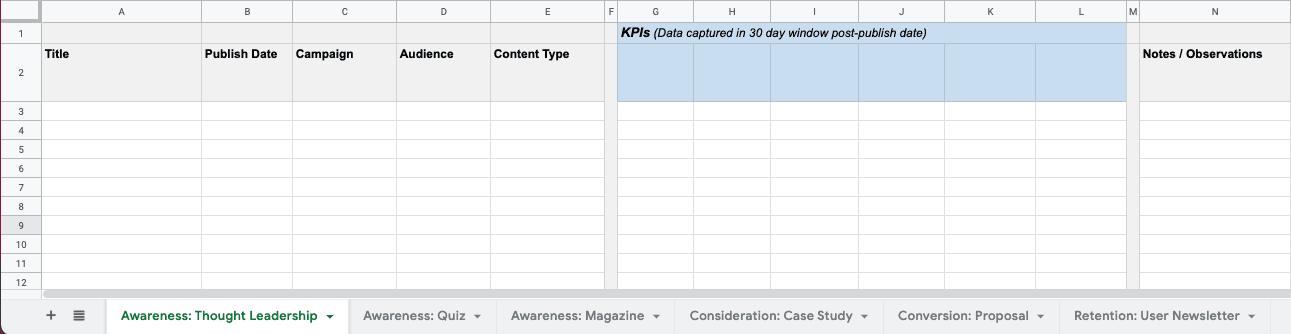
Go to Google Sheet
Refer back to KPI ideas
Handy tip: Use workspaces and labels to allow for quick filtering of different content types within Turtl's analytics dashboards. Filtered data can then be exported to a CSV.
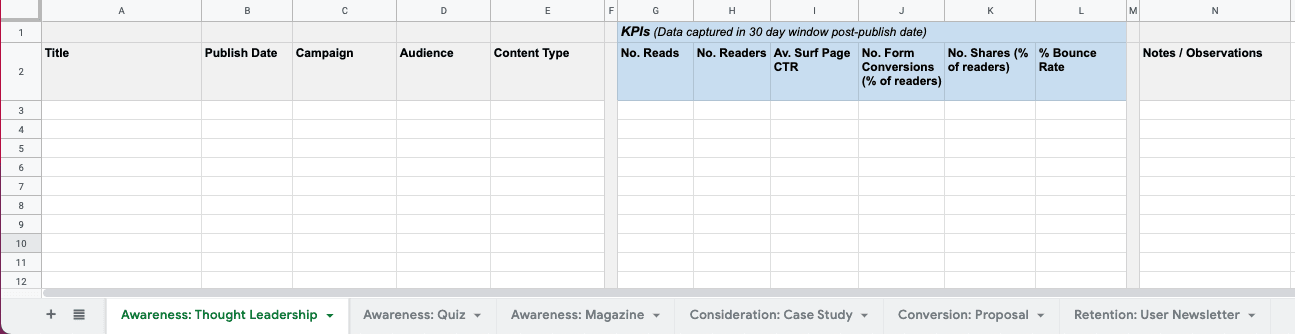
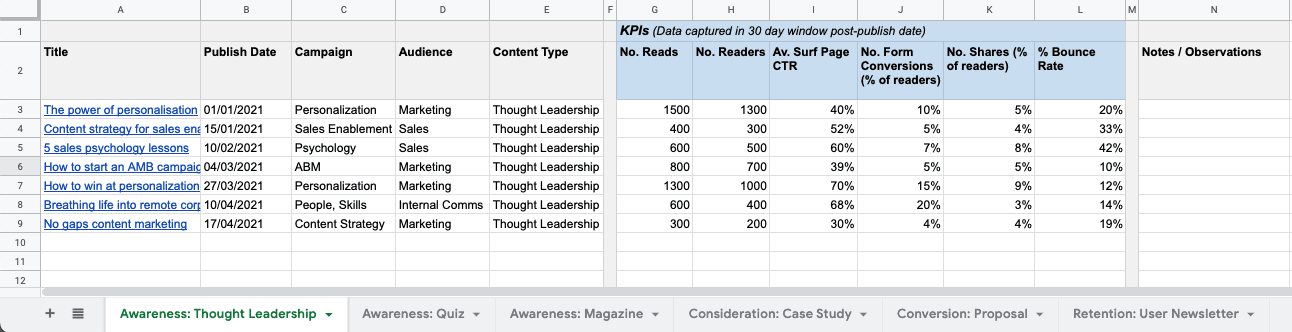
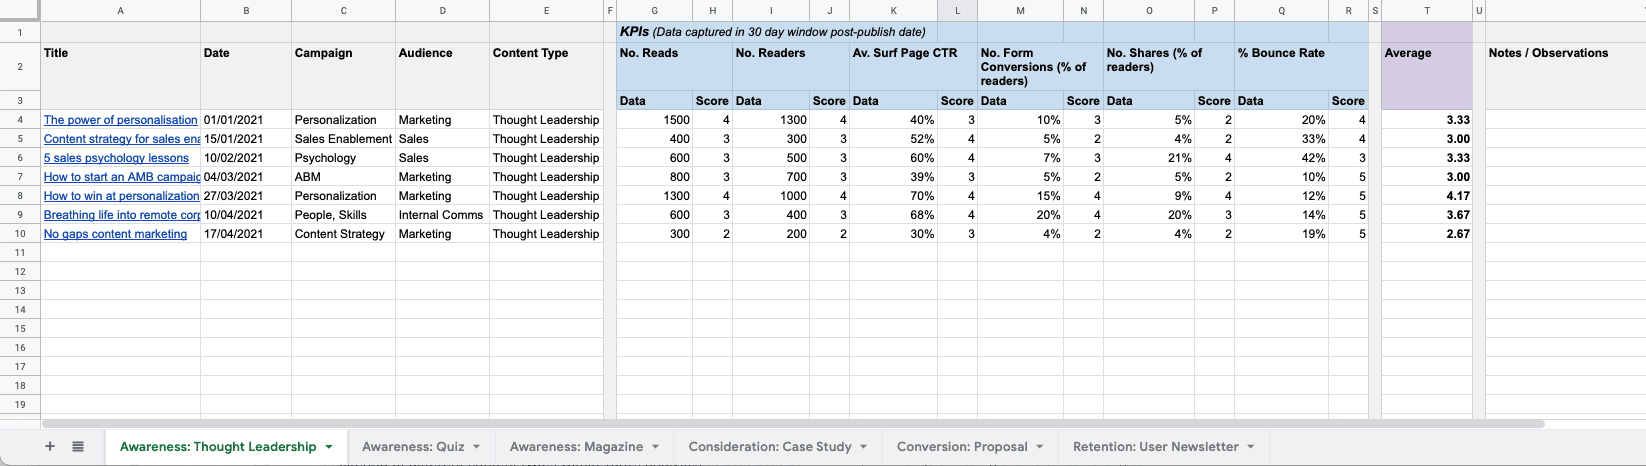
No. Reads
No. Readers
Av. Chapter Page CTR
No. Form Conversions (% of readers)
No. Shares (% of readers)
% Bounce Rate
< 150
100-350
300-1000
1000-2000
> 2000
Example benchmark data
151-350
351-1000
1001-2000
> 2001
0-100
101-300
301-900
901-1800
> 1800
< 10%
10-20%
21-50%
51-70%
> 71%
< 2%
2-5%
6-10%
11-20%
> 21%
2-10%
21-30%
> 31%
> 80%
79-60%
59-40%
39-20%
< 19%