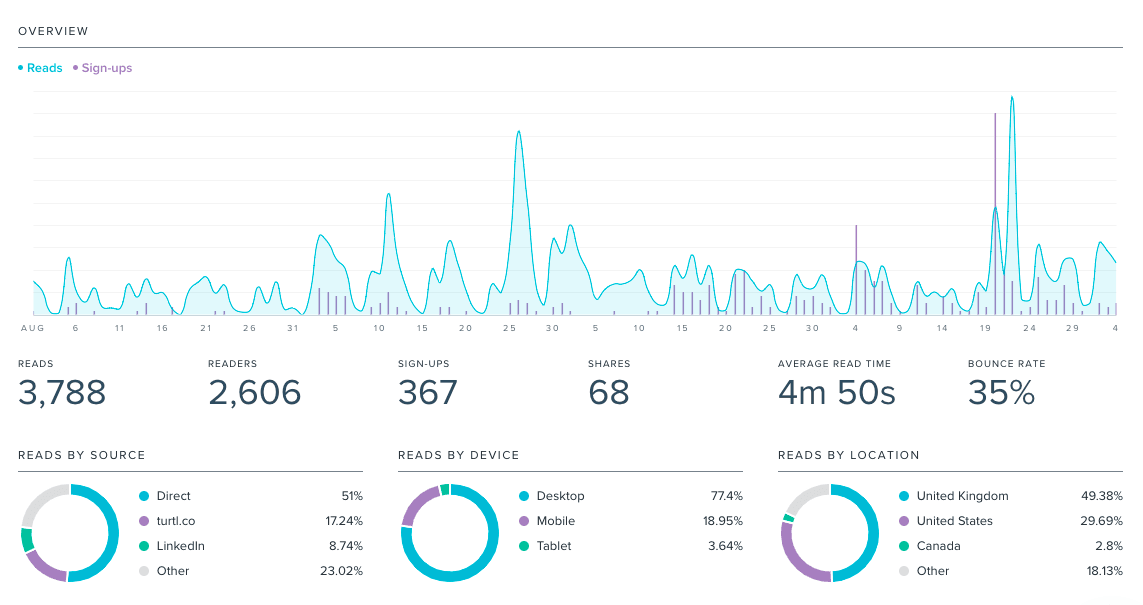
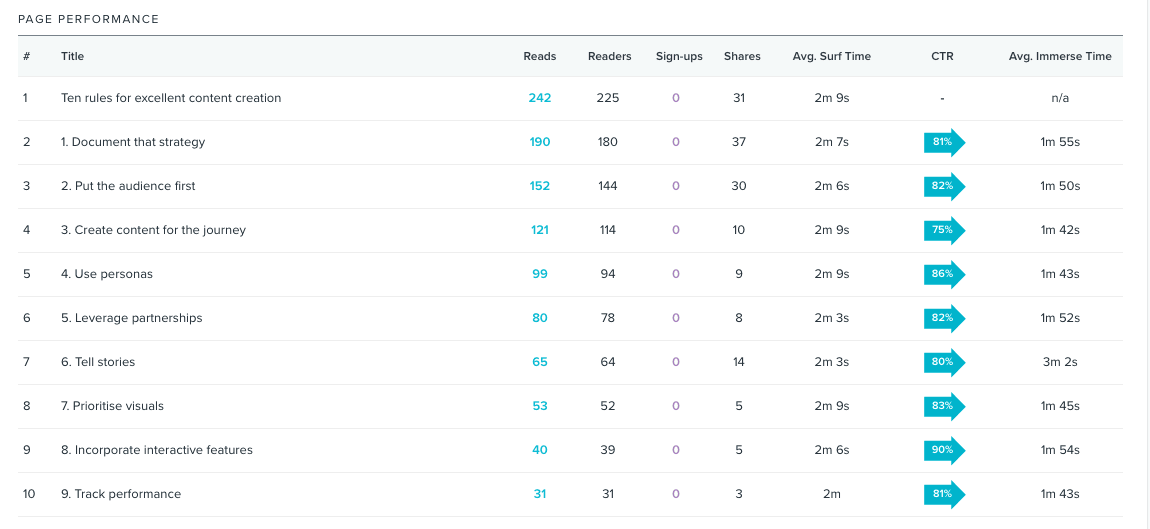
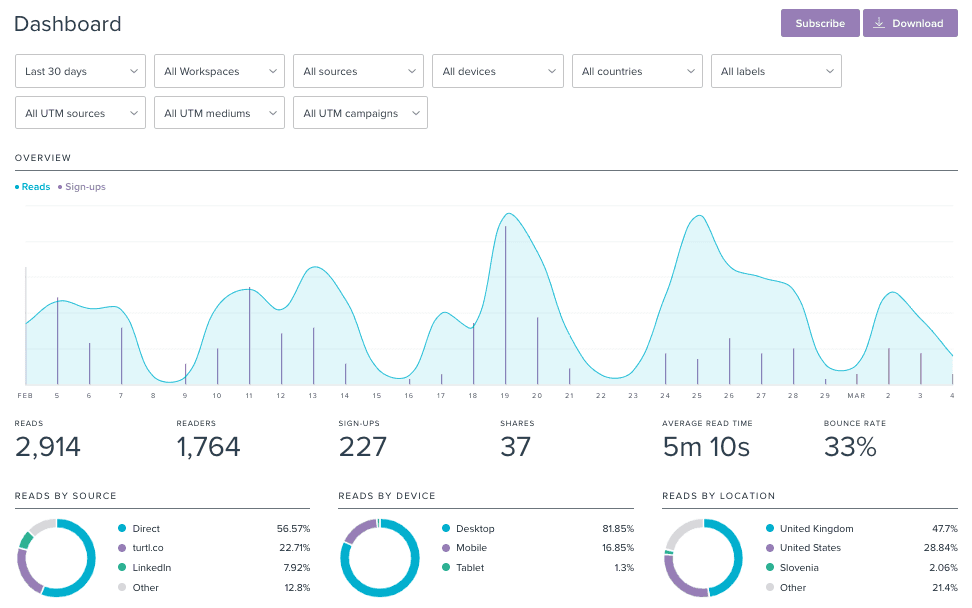
Your document dashboard features the same top-level metrics as your overview dashboard, but the data is specific to the given Turtl Doc. Instead of a document list, you'll have a list of each section in the selected piece with its own metrics.
In addition to the overall engagement with the Doc, you can see how many people read each section, how long they spent reading, and whether they used any of the share buttons.
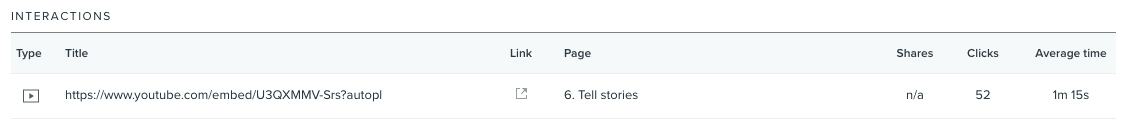
If you've featured interactive widgets like video, links, charts, polls, or shareable quotes, you can see how many people have interacted with each, and for how long.